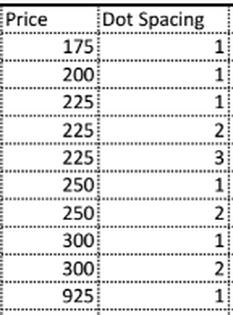
The effect an outlier has on data is that it skews the result and distorts the mean (average). For example. if the average house prices in Sydney were in the $1.1 million range, but a few houses were $100,000 then the mean decreases. An outlier doesn't really effect the mode or the median. Graphing data on a dot plot helps to identify the outliers. For E.g. imagine these are the sale prices of the last 10 properties sold by Nikolai Crofton real estate in Forbes
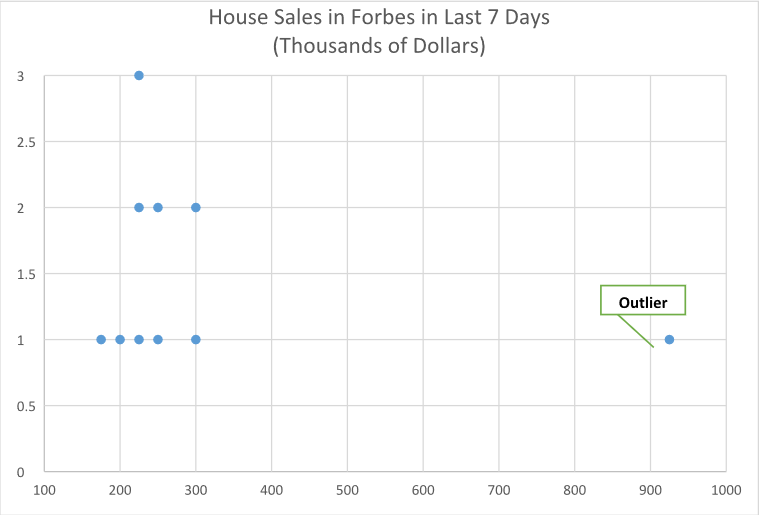
Based on this data, including the outlier, the mean, mode, median and range are as follows:
mean=$307,500
mode=$225,000
median=$237,500
range=$750,000
In discussion with the real estate management we decided that the house sold for $925,000 was a historic home that will never be sold again in this market so we decided to discount it from the data to give a more true indication of the real estate market.
Based on this data, excluding the outlier, the mean, mode, median and range are as follows:
mean=$238,888
mode=$225,000
median=$225,000
range=$125,000
So in conclusion, an outlier will affect the range and the mean more significantly than the mode and median which may explain why the median and not the mean house price is used in Sydney.
So to use my data from my survey as it was collected , the mean, mode, median and range are as follows:
mean = 0.60
mode = 0
median= 0
range = 5
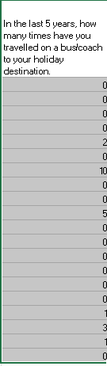
If there were to be an outlier, and we substituted a 0 response with a 10 response, the raw data would look like the table below. The mean, mode, median and range would be as follows:
mean = 1.1
mode = 0
median= 0
range = 10
As the mean is not an appropriate statistical calculation for this survey, then the change in the mean from 0.6 to 1.1 does not drastically change the outcome of the analysis of the survey data.
mean=$307,500
mode=$225,000
median=$237,500
range=$750,000
In discussion with the real estate management we decided that the house sold for $925,000 was a historic home that will never be sold again in this market so we decided to discount it from the data to give a more true indication of the real estate market.
Based on this data, excluding the outlier, the mean, mode, median and range are as follows:
mean=$238,888
mode=$225,000
median=$225,000
range=$125,000
So in conclusion, an outlier will affect the range and the mean more significantly than the mode and median which may explain why the median and not the mean house price is used in Sydney.
So to use my data from my survey as it was collected , the mean, mode, median and range are as follows:
mean = 0.60
mode = 0
median= 0
range = 5
If there were to be an outlier, and we substituted a 0 response with a 10 response, the raw data would look like the table below. The mean, mode, median and range would be as follows:
mean = 1.1
mode = 0
median= 0
range = 10
As the mean is not an appropriate statistical calculation for this survey, then the change in the mean from 0.6 to 1.1 does not drastically change the outcome of the analysis of the survey data.